
Margin of Safety Calculator
Know your buffer before you buy
Enter the price and your value estimate
Free · No sign-up · Updates as you type
What the share trades at today, e.g. 65.
What you think a share is really worth, e.g. 100.
Not sure what to put as your fair-value estimate? Try the DCF calculator, which works one out from the cash a business makes. For a ceiling price instead, the most a cautious buyer should pay, check today's price against the Graham Number.
65.00 is 35.0% below your estimate of 100.00: a big discount
You would pay 35.00 less than you think the share is worth. That 35.0% is your margin of safety: the share could turn out to be worth 35.0% less than you think and you would still not have overpaid. On this calculator's scale, over 30% is a big discount. A gap this wide can also mean the estimate is too generous, so check it before you rely on it.
Big discount
Paying a premium
over 30%
15 to 30%
0 to 15%
below 0%
These bands are this calculator's own guidance, not a rule. How much margin you need depends on how sure you are of your estimate: the harder the business is to value, the more you want.
The numbers behind that
Your fair-value estimate
What you think one share is worth. It is your own figure, so everything below is only as good as it is.
100.00
Share price today
35.00 less than your estimate.
65.00
Margin of safety
35.00 divided by your estimate of 100.00. It is how far the share's real worth could fall short of your estimate before 65.00 became too much.
35.0%
The prices where the answer changes
Click a price to jump to the price field and try it.
- Up to 69.99: a margin of safety over 30%, a big discount on this calculator's scale.
- Up to 85.00: a margin of safety of 15% or more, a discount on this calculator's scale.
- Up to 100.00: you pay no more than your estimate, with a thin cushion or none. Above it you pay a premium.
Where to get a fair-value estimate
This answer is only as good as your estimate. Two places to look for a figure: a discounted cash flow model, which estimates what a share is worth, and the Graham Number, which is a ceiling price from earnings and book value, not an estimate of worth.
DCF calculator · Graham Number calculator
What if your value estimate is off?
Your estimate is a guess, and the margin of safety depends entirely on it. Here is the margin at today's price if a share is really worth 10% or 20% less, or more, than you think.
| If a share is worth | Margin of safety | Verdict |
|---|---|---|
| 80.00 (-20%) | 18.8% | Discount |
| 90.00 (-10%) | 27.8% | Discount |
| 100.00 (yours) | 35.0% | Big discount |
| 110.00 (+10%) | 40.9% | Big discount |
| 120.00 (+20%) | 45.8% | Big discount |
This calculator applies the classic value investing formula pioneered by Benjamin Graham: Margin of Safety (%) = (Intrinsic Value − Current Price) ÷ Intrinsic Value × 100. A positive result means the stock is trading below your estimated fair value; a negative result means it is trading above it.
MoS (%) = (Intrinsic Value − Price) ÷ Intrinsic Value × 100
Step 1: Enter the current market price of the stock you are evaluating.
Step 2: Enter your estimated intrinsic value. You can use our Graham Number calculator, a DCF model, or any other valuation method.
Step 3: The margin of safety, a colour-coded verdict, a visual gauge, and a sensitivity table appear instantly as you type.
Step 4: Use the verdict as a signal, not a guarantee. A strong margin of safety reduces risk but never eliminates it.
What Is the Margin of Safety in Value Investing?
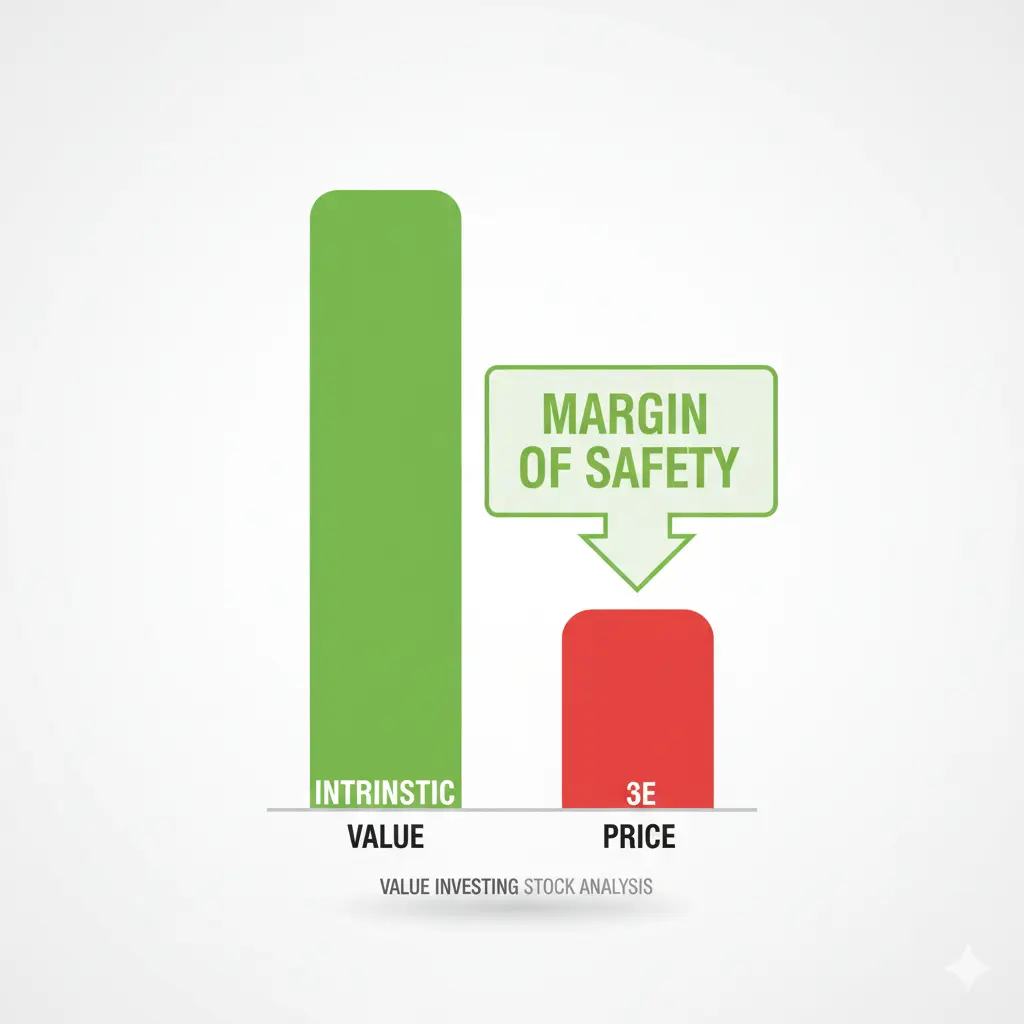
The margin of safety is the difference between a stock's intrinsic value and its current market price, expressed as a percentage of intrinsic value. It is the central idea of value investing, made famous by Benjamin Graham in Security Analysis (1934) and The Intelligent Investor (1949). Graham argued that buying a stock at a significant discount to its intrinsic value provides a buffer, a margin of safety, that protects investors against valuation errors, unforeseen events, and market volatility.
Warren Buffett, Graham's most famous student, has called the margin of safety the three most important words in investing. Unlike speculative approaches that rely on momentum or sentiment, value investing demands that investors know what they are buying and refuse to overpay. The margin of safety quantifies exactly how much of a discount you are getting, and therefore how much room for error you have.
The Margin of Safety Formula Explained
MoS (%) = (Intrinsic Value − Current Price) ÷ Intrinsic Value × 100
If a stock's intrinsic value is $100 and it trades at $70, the margin of safety is 30%. If it trades at $110, the margin is negative 10%, meaning you are paying a 10% premium over fair value. The formula is straightforward, but its power lies in the quality of the intrinsic value estimate feeding it.
Common methods for estimating intrinsic value include the Graham Number (a quick screen based on EPS and book value), discounted cash flow (DCF) analysis (which projects future free cash flows and discounts them back to present value), earnings power value (EPV), and asset-based valuation. Each has strengths and limitations. The margin of safety calculation itself is always the same; only the input quality varies.
How Much Margin of Safety Is Enough?
For bargain stocks, Graham required a margin of safety of at least 33%; for bonds he checked that profits covered the interest several times over. The required cushion depends on the uncertainty of the intrinsic value estimate: the more difficult the business to value (e.g., early-stage companies, cyclical industries), the larger the required margin of safety. For straightforward, stable businesses with predictable cash flows, a 15 to 20% margin may be adequate.
Our calculator uses these bands as its own guidance: above 30% is a big discount, 15 to 30% is a discount, 0 to 15% is a thin cushion, and below 0% means you would be paying a premium, a price above your own estimate. These are not hard rules; they are starting points for further analysis. A 5% margin of safety on a rock-solid blue-chip may be more attractive than a 40% margin on a highly speculative company.
Using This Tool Alongside Other Value Calculators
The margin of safety calculator is most powerful when combined with a reliable intrinsic value model. Start with our Graham Number calculator to get a quick intrinsic value estimate, then plug that figure in here to see your margin of safety. For a deeper analysis, use a DCF model and feed that present value into this calculator.
Remember: the margin of safety is a risk-management tool, not a buy signal on its own. Always consider the quality of the business, the sustainability of its competitive advantage, management quality, and macroeconomic context before making any investment decision. This calculator assists analysis; it does not replace it.
Frequently Asked Questions About Margin of Safety
Benjamin Graham wanted at least 33% when buying bargain stocks. In practice, most value investors look for 20 to 50% depending on the certainty of their intrinsic value estimate. For highly predictable businesses (e.g., consumer staples, utilities), 15 to 20% may suffice. For less predictable companies (technology, biotech, cyclicals), many investors demand 40 to 50% or more. There is no universal number: the required margin reflects how confident you are in your valuation.
The most common approaches are: (1) Graham Number, the square root of 22.5 times EPS times book value per share, useful for traditional value stocks; (2) DCF analysis, projecting free cash flows 5 to 10 years forward and discounting at an appropriate rate (WACC); (3) Earnings Power Value, current normalised earnings divided by the cost of capital; (4) comparable company analysis, applying an industry average P/E or EV/EBITDA multiple. Each method produces a different estimate, so many investors average several models to reduce error.
Not necessarily. A very high margin of safety can signal genuine undervaluation, but it can also mean your intrinsic value estimate is wrong, the market knows something you do not (e.g., deteriorating fundamentals), or the stock is a value trap, a company that appears cheap but continues to decline. Always investigate why a stock is trading at a large discount before assuming it is an opportunity. The margin of safety reduces risk on accurate valuations; it cannot compensate for a flawed analysis.
The Graham Number is one method of estimating intrinsic value. The margin of safety is what you calculate after you have an intrinsic value estimate: it tells you how much of a discount the current market price represents. You can use our Graham Number calculator to generate an intrinsic value, then feed that number into this margin of safety calculator to see how the current price compares.
For a deeper dive, read our companion article: What Is the Margin of Safety? A Value Investor's Guide
Screen for Stocks, Record What You Own
Knowing your margin of safety is the first step. With a free Worthmap account, you can use the stock screener and AI analysis to study companies, and record the stocks you buy alongside the rest of your net worth, in one base currency you pick. The free plan is in beta.
Create free accountBuilt & maintained by Worthmap · Last updated September 30, 2026
Educational use only. This tool provides estimates for informational purposes and does not constitute financial, investment, tax, or legal advice. Results are based on inputs you provide and mathematical models, they do not guarantee future performance. Always consult a qualified financial adviser before making investment decisions.