
Net Worth Intelligence
Comprehensive Wealth Tracking Across All Currencies
Worthmap is built for people whose money sits in more than one country and more than one currency. The multi-currency net worth tracker is now open, and its free plan is in beta. The calculators, articles, beginner's guide and glossary stay free and need no account.
Each asset in its own currency
Multi-asset tracking
Free calculators, no account needed

Platform Features
Everything You Need to Understand and Track Your Finances
Worthmap puts two things side by side: a net worth tracker that adds up money held in several currencies, and a set of free calculators, articles and guides for the arithmetic behind each decision.

01
Multi-Currency Net Worth Tracking
A multi-currency net worth tracker for people whose money sits in more than one currency. Record your assets and liabilities, each in its own currency, and see them added up in a base currency you pick. Log income and expenses, follow stocks, crypto and dividends, and see on a chart how your net worth has changed over time. It needs a free account, and its free plan is in beta.

02
Free Value Investing Calculators
Go beyond a price chart without paying for a terminal. The Graham Number calculator turns earnings and book value into a single ceiling figure, the margin of safety calculator shows how much room the price on offer actually leaves you, and the PEG, present value, WACC and dividend calculators handle the rest of the arithmetic a value investor keeps redoing by hand. Each one recalculates as you type and shows its working rather than only the answer, none of them asks for an account, and the articles explain what each figure can and cannot tell you.

03
Asset Allocation and Rebalancing Tools
Where your money is allocated is something you can measure today, even if where capital flows next is not. The asset allocation calculator sets the weights you want across asset classes, the portfolio rebalancing calculator shows how far each holding has drifted from them and what it would take to bring it back, and the articles cover how sector and asset class exposure is normally thought about without pretending anyone can time the turn.

04
Currency Exposure and FX Impact Tools
When your money sits in several currencies, exchange rates move your wealth even when your investments stand still. The currency exposure calculator shows what share of a portfolio is really in each currency once you look through the holdings. The FX impact calculator splits a period's return into the part the asset earned and the part the exchange rate moved. In the net worth tracker, each asset and liability keeps its own currency and is converted into the base currency you pick.
Inside the app
What the app does for you
Here is what you get with a free account at my.worthmap.com. The whole app works in your language: English, Italian, French, German, Chinese or Spanish.
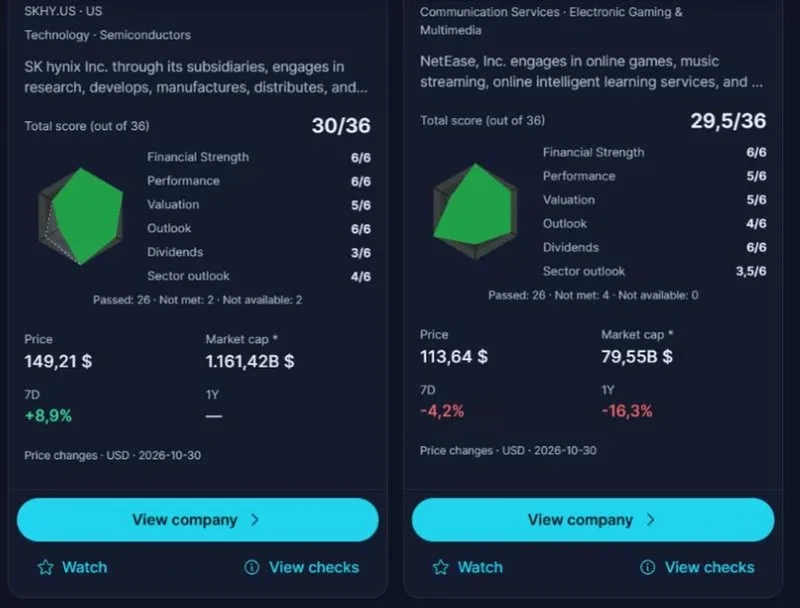
Stock screener
Screen thousands of shares with clear rules
Filter thousands of shares by sector, by how their price compares with the company's figures and by how solid the business is. Each one gets a total score out of 36 from fixed rules in six areas (financial strength, performance, valuation, outlook, dividends and sector outlook), so you can see at a glance which companies meet more of the rules and where to start reading. The score is the result of a checklist, not a tip to buy or sell.
- Filter by sector, price and quality
- A score out of 36 across six areas
- Save a screen and run it again later
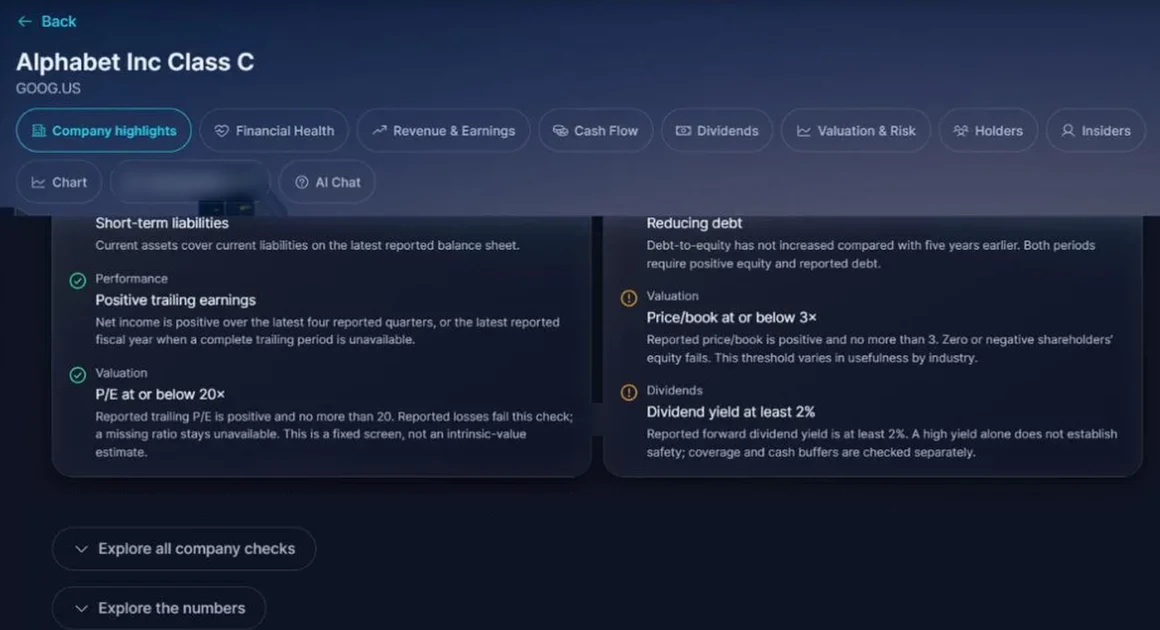
Company analysis
Understand a company on one page
Open any company and see its score, its price and its market value in one place. Every check it passed or did not meet comes with a plain reason, so you can see for yourself which rule the figures meet and which they miss, instead of just being told.
- Its score and the six areas behind it
- Each check passed or failed, and why
- Price and market value, updated daily
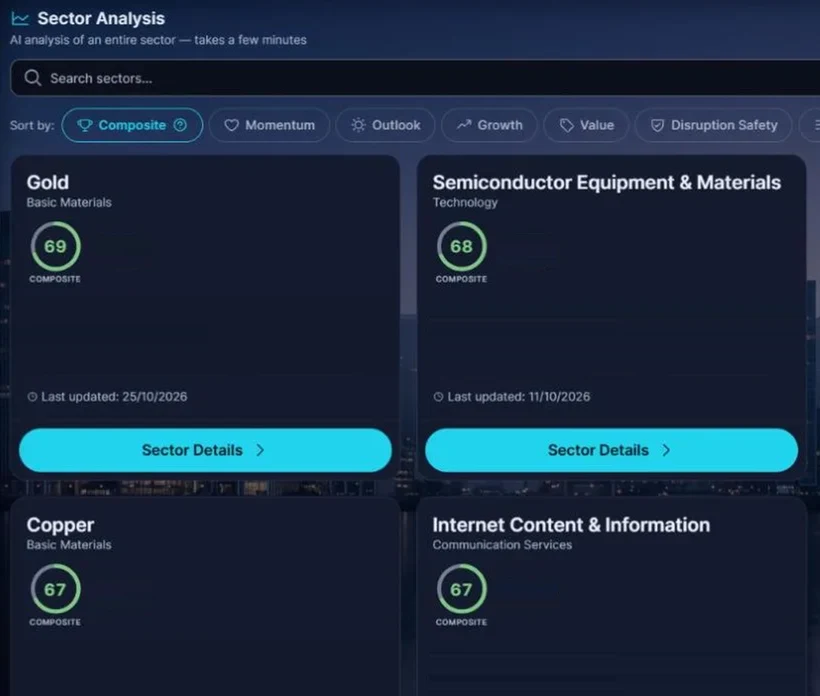
Sector analysis
Compare whole sectors side by side
Compare whole sectors, such as gold, copper or semiconductors, by their score, momentum, growth and value. Each sector comes with a short summary written by AI and the date it was last updated. Read it as one opinion to check for yourself, not as advice for your situation.
- Sectors ranked by their score
- Sort by momentum, growth or value
- A short AI-written summary, with its date
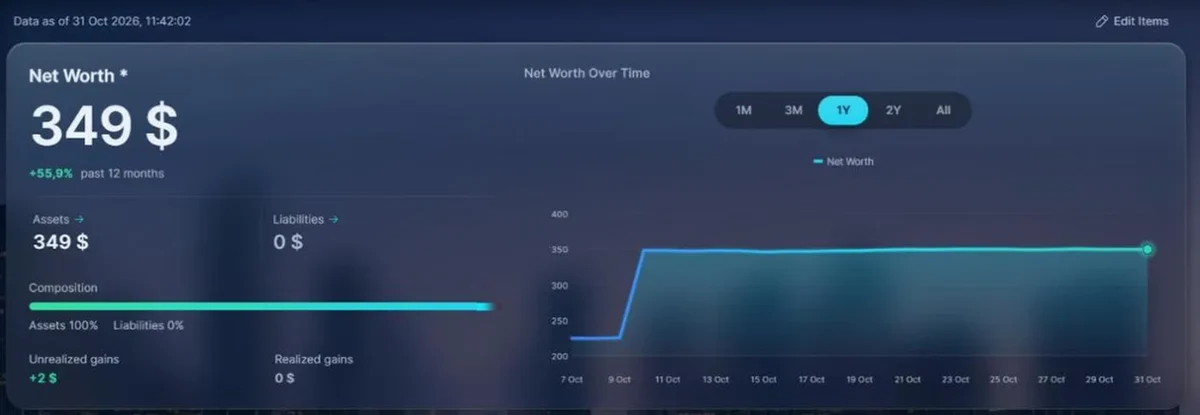
Net worth
All your money in one place
Add what you own, what you owe, what you earn and what you spend, each in its own currency. The app adds it all up in the currency you choose and draws a chart of how your net worth changes over time.
- Assets, debts, income and expenses
- Many currencies, one total
- A chart of your net worth over time
Watchlist
Keep an eye on the companies you like
Add a company to your watchlist with one click and find it again whenever you want to see how it is doing.
Try it with your own figures and the companies you follow: you can start for free.
Create free accountScreenshots taken from the app in October 2026. Prices, scores and summaries change over time.
For information and education only. Worthmap does not know your situation and does not give personal investment advice. Scores follow fixed rules and sector summaries are written by AI from public data; neither is a recommendation to buy or sell any security. Investing carries risk, including the loss of money. Read the full disclaimer
Compare
How Worthmap compares with Simply Wall St and others
Simply Wall St, Investing.com and Yahoo Finance are good places to research shares. Worthmap brings net worth tracking and stock analysis together in one app, fully in your language.
| What you get | Worthmap | Simply Wall St | Investing.com | Yahoo Finance |
|---|---|---|---|---|
| Whole app in your languageIn Italian, French, German and Chinese, not only English | Yes | Reports and profile, no Chinese | Market data in several languages | Market data in several languages |
| Track your net worthYour home, bank accounts, debts, income and expenses | Yes | Stock portfolios only | Not the focus | Not the focus |
| Stock screenerFilter shares to find the ones worth a closer look | Yes | Yes | Yes | Yes |
| Company score or checklistWorthmap scores each company out of 36 on financial strength, performance, valuation, outlook, dividends and sector outlook. | Yes, a score out of 36 | Yes, its "snowflake" analysis | With InvestingPro (paid) | Analyst ratings |
| Free planWhat you can use without paying | Yes, free plan in beta | Yes, 5 company reports a month | Free basic access | Free basic access |
Whole app in your language
In Italian, French, German and Chinese, not only English
- Worthmap
- Yes
- Simply Wall St
- Reports and profile, no Chinese
- Investing.com
- Market data in several languages
- Yahoo Finance
- Market data in several languages
Track your net worth
Your home, bank accounts, debts, income and expenses
- Worthmap
- Yes
- Simply Wall St
- Stock portfolios only
- Investing.com
- Not the focus
- Yahoo Finance
- Not the focus
Stock screener
Filter shares to find the ones worth a closer look
- Worthmap
- Yes
- Simply Wall St
- Yes
- Investing.com
- Yes
- Yahoo Finance
- Yes
Company score or checklist
Worthmap scores each company out of 36 on financial strength, performance, valuation, outlook, dividends and sector outlook.
- Worthmap
- Yes, a score out of 36
- Simply Wall St
- Yes, its "snowflake" analysis
- Investing.com
- With InvestingPro (paid)
- Yahoo Finance
- Analyst ratings
Free plan
What you can use without paying
- Worthmap
- Yes, free plan in beta
- Simply Wall St
- Yes, 5 company reports a month
- Investing.com
- Free basic access
- Yahoo Finance
- Free basic access
Comparison based on each provider's public pages, checked October 2026.
This table covers only these five points. The other sites offer plenty we do not list here, and prices and plans change, so check each provider's own page before you choose.
Create free accountManaging wealth is complicated - especially across borders. The tools you use should not be.
Start with the free tools - 30+ calculators, in-depth guides, and an investing education path built from the ground up. No account, no signup, no limits.
Ready to See Your Complete Financial Picture?
The net worth tracker is open now. Create a free account to try it. The free plan is in beta, so tell us if something looks wrong. The calculators, the articles, the beginner's guide and the glossary stay free, with no account needed.
100% Free - No Login Required
Free Financial Tools, Education, and Research
Beyond the core platform, we provide a growing library of free resources - because we believe better investors are made, not born. Everything below works without an account, without a paywall, and without limits.
Free forever
30+ Free Investment Calculators
Model the scenario you are actually facing: compound interest over decades, a monthly investment plan, the Graham Number and margin of safety on a share you are weighing up, WACC and discounted present value, dividend income, position size, the order in which to pay off debts, and the FIRE targets. Every one of them is free, permanently, and none of them asks you to register.
Financial Blog & In-Depth Guides
The blog covers the questions that will not fit inside a calculator: how to build a multi-currency portfolio, how to work out your net worth when it is denominated in four currencies at once, what Benjamin Graham actually argued, how sector rotation is normally described, and how asset allocation gets decided. Every article is published in English, Italian, French, Chinese and German.
Investing Education for Beginners
New to investing? Our structured learning guides cover the fundamentals - from understanding what a stock is to building your first diversified portfolio. Learn about asset allocation, risk management, compound growth, and financial planning at your own pace.
Stay Ahead of New Features
We're constantly building new tools and features. Leave your email and we'll notify you as soon as they're ready.
No spam. Unsubscribe any time.
Your wealth, clear and in control
Three steps to financial clarity, wherever you are in the world.
1
Add your assets
Stocks, real estate, cash, and more, in any currency. Worthmap converts everything into your base currency automatically.
2
See your wealth over time
Your net worth today and how it has changed over time, all shown in the base currency you pick.
3
Research with confidence
The free calculators work through the numbers on a share, a savings plan or a portfolio and show their working, and the free app account adds a stock screener and AI analysis. The decisions are always yours.
Mobile app
Take Worthmap with you
The Worthmap app on iPhone and Android uses the same account as the web app, so you sign in on your phone and see your net worth and the stock analysis tools right away. It is free to start.
 Scan with your phone camera
 Scan with your phone camera
Frequently Asked Questions
Worthmap is a net worth tracker and a free set of investment tools and writing for people who hold money in more than one currency: expats, cross-border workers, and anyone whose salary, mortgage and investments are not all in the same one. The tracker is open. You record your assets, liabilities, income and expenses, each in its own currency, and see them added up in one base currency you pick. It needs a free account, and its free plan is in beta. The calculators, the articles, the beginner's guide and the glossary need no account at all.
In the tracker, you give each asset and liability its own currency: a flat in euros, shares in dollars, savings in pounds. You pick one base currency, and Worthmap converts everything into it, so you see a single net worth figure and a chart of how it has moved over time. You can log income and expenses the same way. If you want to see how much of a change came from the exchange rate rather than the investment itself, the free FX impact calculator makes that split.
Yes. Every calculator on the site is free and runs in your own browser: Graham Number, margin of safety, WACC, present value, compound interest, SIP and DCA, dividend income, portfolio rebalancing, currency exposure, FX impact, debt snowball, option pricing and the FIRE targets among them. The articles, the beginner's guide and the glossary are free too. The net worth tracker has a free plan. It is in beta, so a few figures or features may still contain errors. The Pro and Enterprise plans are not available yet.
The main difference is currencies. In the tracker, each asset and liability keeps its own currency, and the total is converted into a base currency you pick, so money spread over several countries adds up to one figure. The tracker also follows stocks, crypto, dividends and stock splits, has a stock screener and AI analysis, and can import a broker statement as a PDF or CSV file. Around it, the free calculators are built for the same problem. The currency exposure tool shows what share of a portfolio is really in each currency once you look through the holdings, and the FX impact calculator splits a period's return into the part the asset earned and the part the exchange rate moved. Every page exists in English, Italian, French, Chinese and German.
The FX tools work in fourteen currencies: US, Australian, New Zealand, Canadian, Singapore and Hong Kong dollars, euro, pound, Swiss franc, yen, yuan, Thai baht, Vietnamese dong and Indian rupee. That is the whole list today. The calculators do not scan or quote any market: they work on the numbers you give them, taken from whichever exchange your holdings happen to sit on. The stock screener is part of the net worth tracker at my.worthmap.com, where you can see what it covers once you have a free account.