
Compound Interest Calculator
See how your investments grow over time with the power of compounding
Enter your plan and see what it grows to
Free · No sign-up · Updates as you type
$
What you start with. Can be 0.
$
Added every month. Can be 0.
Long-run return, e.g. 8 for 8%. The S&P 500 has averaged about 10%.
How long you stay invested, e.g. 20.
Money you add is counted at the end of each compounding period, so with yearly compounding the whole year's deposits arrive at year end.
What you would end up with
$343,778
after 20 years
$130,000 of that is money you put in yourself. The other $213,778 is growth.
The numbers behind that
Money you put in
$10,000 to start, plus $500 a month for 20 years, which comes to $120,000.
$130,000
Growth on top of that
62.2% of what you would end up with. It is growth on your money and growth on earlier growth (the compound interest), at 8.0% a year, added every month. At 8.0% a year, money doubles about every 9 years (the Rule of 72, a rough rule).
$213,778
True yearly rate once compounding is counted
8.0% a year, added every month, works out to 8.30% over a full year, because growth added during the year earns growth too.
8.30%
What would change the result
Click a line to jump to the field it talks about.
- Leave it 5 more years, 25 years in all, and you would end up with $548,915: $205,137 more, of which $30,000 is extra money from you.
- Put in $600 a month instead of $500 and after 20 years you would end up with $402,680: $58,902 more, of which $24,000 is the extra money itself.
- The return is a guess. At 7.0% a year you would end up with $300,851; at 9.0% a year, with $394,035.
What these figures will buy by then
This is the amount you would see on the statement after 20 years, not what it will buy. Prices rise in the meantime. To see the result in today's prices, take the inflation you expect off the yearly return: with a return of 8% and inflation of 3%, type 5.
What a different return would do
How to add a return to compare
Add another yearly return and see how much the end result moves. Small differences add up over decades.
%
8% (your rate)
5%
10%
Contributions
| Yearly return | You would end up with | Growth | Compared with your rate |
|---|---|---|---|
| 10% | $452,965 | $322,965 | +$109,187 |
| 8% (your rate) | $343,778 | $213,778 | yours |
| 5% | $232,643 | $102,643 | -$111,135 |
Small differences compound into life-changing amounts. As you can see above, even a 1-2% difference in annual returns can mean tens or hundreds of thousands of dollars over a long investment horizon. The question is: how do you move your returns higher? The Graham Number and margin of safety calculators on this site help you judge whether a share is priced sensibly before you buy.
Explore Worthmap's free investment tools →Year by year
| Year | Money put in so far | Growth | Total at year end |
|---|---|---|---|
| 1 | $16,000 | $1,055 | $17,055 |
| 2 | $22,000 | $2,695 | $24,695 |
| 3 | $28,000 | $4,970 | $32,970 |
| 4 | $34,000 | $7,932 | $41,932 |
| 5 | $40,000 | $11,637 | $51,637 |
| ··· | |||
| 16 | $106,000 | $123,419 | $229,419 |
| 17 | $112,000 | $142,685 | $254,685 |
| 18 | $118,000 | $164,049 | $282,049 |
| 19 | $124,000 | $187,684 | $311,684 |
| 20 | $130,000 | $213,778 | $343,778 |
Insight: Compound interest rewards time. The longer your money stays invested, the more of its growth comes from growth it has already made, which is why the line climbs faster in the later years. Starting early gives every amount you invest more of those years, so the same savings started ten years sooner can end up much larger.
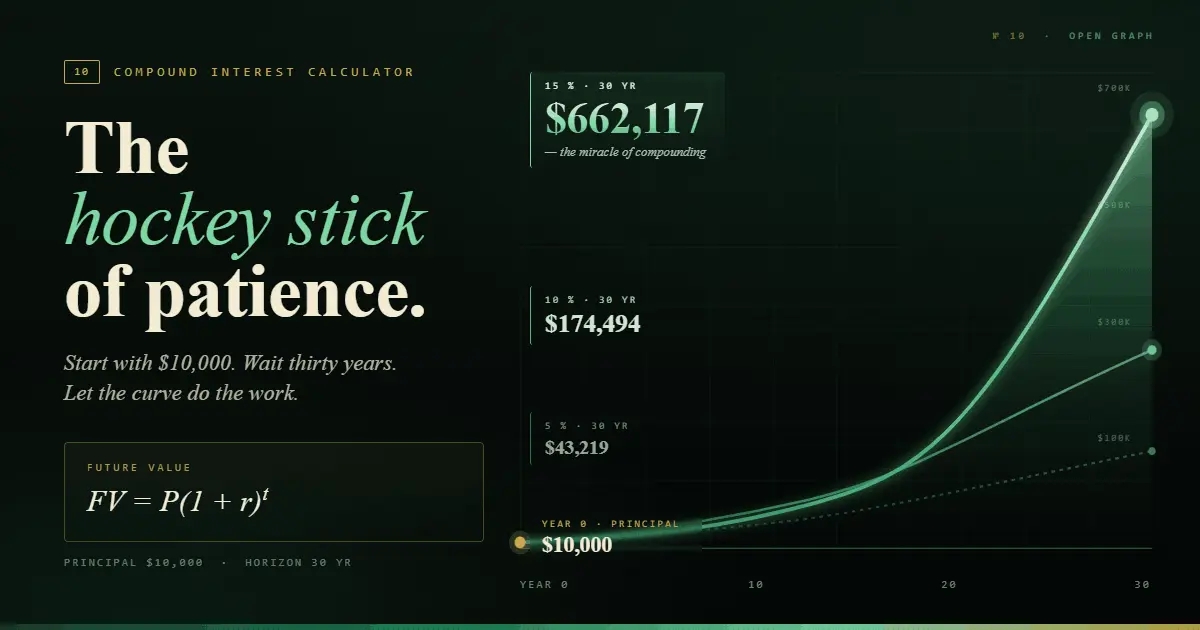
Compound interest is the process of earning interest on both your original principal and previously accumulated interest. Unlike simple interest (which is calculated only on the initial amount), compound interest causes your wealth to grow exponentially over time. Albert Einstein reportedly called it the eighth wonder of the world.
FV = P(1 + r/n)^(nt) + PMT × [((1 + r/n)^(nt) - 1) / (r/n)]
Step 1: Enter your initial investment amount (the lump sum you are starting with). This can be zero if you are starting from scratch.
Step 2: Enter your monthly contribution, the amount you plan to add each month through dollar cost averaging or a systematic investment plan.
Step 3: Set your expected annual return rate. The historical S&P 500 average is approximately 10%, though many planners use 7-8% to account for inflation.
Step 4: Choose your investment period and compounding frequency. The projection and year-by-year breakdown update instantly as you type.
What Is Compound Interest?
Compound interest is the mechanism by which your investment earnings generate their own earnings. When you invest $10,000 at 8% annual return, you earn $800 in the first year. In the second year, you earn 8% on $10,800, that is $864. By year 20, your annual earnings alone exceed your original investment. This exponential growth is the foundation of long-term wealth building.
The key variables that determine compound growth are the principal amount, the rate of return, the compounding frequency, and most importantly, time. The longer your money compounds, the more dramatic the results. This is why an investment calculator for compound growth is one of the most important tools for anyone planning their financial future, whether you are saving for retirement, a major purchase, or working toward your financial independence number.
Dollar Cost Averaging and Compound Interest
Dollar cost averaging (DCA), investing a fixed amount at regular intervals, is one of the most effective strategies for building wealth over time. This dollar cost averaging calculator shows how even modest monthly contributions can grow into substantial sums when combined with compound interest. A systematic investment plan of $500 per month at 8% annual return grows to roughly $475,000 in 25 years, even though you only contributed $150,000. Use this as a systematic investment plan calculator to model your own DCA strategy.
The advantage of dollar cost averaging is that it removes the need to time the market. By investing consistently, you buy more shares when prices are low and fewer when prices are high, naturally averaging your cost basis. Combined with compound interest, this disciplined approach has historically outperformed most active trading strategies over long time horizons.
Compound Interest for Retirement Planning
An investment calculator for retirement planning helps you answer the most important financial question: will I have enough? By projecting your current savings and contributions forward at a realistic rate of return, you can see whether you are on track to reach your financial independence number, and how adjusting your contributions or timeline changes the outcome. To use it for retirement, change the monthly amount or the number of years until the end result reaches the pot you want.
For those pursuing financial independence, this calculator is essential for Coast FIRE planning (where your investments grow to your target without further contributions) and Barista FIRE planning (where part-time income covers expenses while investments compound). The difference between retiring at 55 versus 65 often comes down to a few years of additional compounding.
Frequently Asked Questions About the Compound Interest Calculator
The appropriate rate depends on your asset allocation. The S&P 500 has historically returned approximately 10% annually before inflation (about 7% after inflation). A diversified portfolio of stocks and bonds typically returns 6-8%. For conservative estimates, use 6-7%. For optimistic projections, 9-10%. Always run multiple scenarios to understand the range of possible outcomes.
More frequent compounding means your interest starts earning interest sooner, which slightly increases your total return. For example, $10,000 at 8% for 20 years grows to $46,610 with annual compounding but $49,522 with daily compounding, a difference of about $2,912 (6.2% more). The effect is more pronounced at higher rates and longer time horizons.
The Rule of 72 is a quick mental math shortcut for estimating how long it takes to double your money. Divide 72 by your annual return rate to get the approximate doubling time. At 8%, your money doubles in about 9 years (72 ÷ 8 = 9). At 10%, it doubles in about 7.2 years. At 6%, about 12 years. This rule helps you quickly gauge the power of compounding at different rates.
Yes, especially for long-term planning. You can either use a "real" return rate (nominal rate minus inflation, typically 2-3%) or calculate in nominal terms and adjust the final number for inflation separately. For example, if you expect 8% nominal returns and 3% inflation, use 5% as your real return rate to see your future value in today's purchasing power.
Fat FIRE, Lean FIRE & Barista FIRE: Which FIRE Number Is Right for You?
FIRE, Financial Independence, Retire Early, comes in several flavours, each requiring a different target number. Fat FIRE targets a high spending lifestyle in retirement, typically requiring $2 to 5 million or more. A fat FIRE calculator uses a low withdrawal rate (2 to 3%) applied to a large annual expense budget, for instance, spending $120,000 per year at a 3% withdrawal rate requires $4,000,000. You can use this calculator to see what monthly amount, over how many years, gets you to a pot like that.
Lean FIRE targets a frugal lifestyle, typically $800,000 to $1.5 million. A lean FIRE calculator applies the standard 4% rule to a very low annual expense figure, $30,000 per year requires just $750,000. The trade-off is a tighter spending margin and greater sensitivity to sequence-of-returns risk in the early retirement years. Barista FIRE sits between the two: you reach partial financial independence where investments cover most expenses, and part-time income (the "barista" job) covers the remainder. This approach allows an earlier retirement date at a lower investment target. Use the Barista FIRE calculator to find your exact semi-retirement number and see how many years away it is.
Coast FIRE is a milestone rather than a full retirement target: you have accumulated enough that, even without further contributions, your portfolio will compound to your full FIRE number by traditional retirement age. Use the Coast FIRE calculator to find your Coast FIRE number directly; it does that arithmetic for you.
Systematic Investment Plan Calculator, Lump Sum Returns & Monthly Contributions
A systematic investment plan (SIP) calculator, sometimes called a systematic investment planner, shows how regular contributions grow over time through compounding. Unlike a lump sum investment calculator, where you enter a single starting amount, the SIP approach models ongoing monthly or yearly contributions. Returns improve dramatically with regular additions because each new contribution begins compounding immediately, layer upon layer, creating an accelerating wealth curve that a one-time deposit cannot match. Use the dedicated SIP calculator if you only have monthly contributions and want a focused SIP projection with multi-currency support.
Monthly contributions are the most practical SIP scenario: if I invest $500 per month for 20 years at an 8% annual return, what will my portfolio be worth? The calculator above takes a monthly amount. To model a yearly bonus instead, divide it by twelve and enter that as the monthly amount; the result is close enough for planning. Each amount is added at the end of its period and starts compounding from the next one.
To model a lump sum, put the whole amount in Money you start with and set the monthly amount to 0. That is useful when you are deciding what to do with a windfall, an inheritance, a business sale, or a bonus. Here you compare the return on a lump sum invested right away with spreading the same money over time through dollar cost averaging. A 2012 Vanguard study of the United States, the United Kingdom and Australia found that investing everything at once beat spreading it over 12 months in about two thirds of past periods, and a 2023 Vanguard update found the same in more markets. The reason is that stocks and bonds have tended to rise and to earn more than cash, so money invested sooner spends longer in the market while it grows. Spreading your money out does better when prices fall after you start, because you buy the later parts cheaper, and Vanguard found it lost less during market downturns. That is why your comfort with risk and your timeline still decide which suits you.
Track Your Real Investment Growth
Projections are the first step. Worthmap's net worth tracker follows your real balances in every currency and converts them into one base currency you choose, so you can see how your money actually grows. It is open and free to try. The free plan is in beta, so you may meet the occasional error.
Create free accountBuilt & maintained by Worthmap · Last updated September 29, 2026
Educational use only. This tool provides estimates for informational purposes and does not constitute financial, investment, tax, or legal advice. Results are based on inputs you provide and mathematical models, they do not guarantee future performance. Always consult a qualified financial adviser before making investment decisions.