
Sector analysis: compare whole sectors before you pick a company
Companies in the same sector often move together. Gold miners tend to follow the price of gold, copper producers the price of copper, and makers of chip equipment depend on how much the chip factories decide to spend. If you look at the whole sector first, you see the forces that push a whole group of companies up or down at once, and one company's results become much easier to read.
Sector Analysis in the Worthmap app (my.worthmap.com) puts whole sectors and industries side by side, such as Gold, Copper, Semiconductor Equipment & Materials and Internet Content & Information. You get the context first, then decide which companies deserve a closer look.
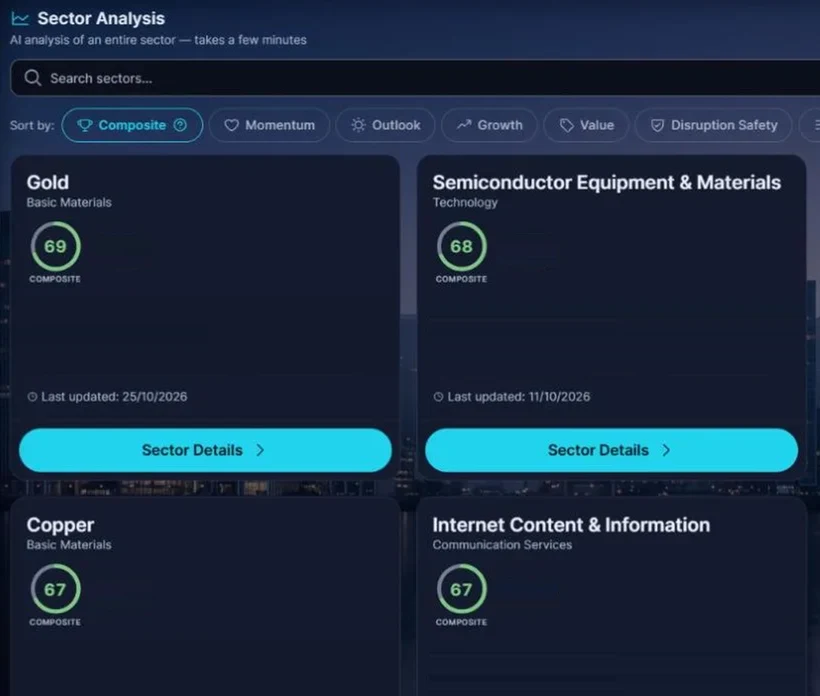
Screenshot from the app, October 2026. Scores and summaries change over time.
For information and education only. Worthmap does not know your situation and does not give personal investment advice. Nothing on this page is a recommendation to invest in any security or sector. Investing carries risk, including the loss of money. Read the full disclaimer
What each sector card tells you
Every sector in the list gets its own card, with three things on it.
A score out of 100
The composite score: one number that lets you line sectors up side by side at a glance. It describes the sector as a whole, not any single company in it.
A short summary written by AI
A few lines on what is going on in the sector. Read it as one opinion, and check it against other sources before you lean on it.
The date of the last update
Tells you how recent the analysis is. Markets move, so with an older date the picture may already have changed.
Click a card to open the Sector Details page for that sector. Generating a new analysis of a sector takes a few minutes.
Sort the sectors by what you want to compare
You can order the list by any of the measures below, or simply alphabetically. Each one answers a different question about a sector.
- Composite
- The combined score out of 100 shown on each card. A good first view.
- Momentum
- Whether the sector's shares have been rising or falling lately, and how strongly. It looks back, so it cannot tell you what comes next.
- Outlook
- How the period ahead looks for the sector, based on what is known today.
- Growth
- How fast the sector's companies are growing their sales and profits.
- Value
- How much you pay for the sector's companies compared with what they earn and own. A low price can have a good reason behind it.
- Disruption safety
- How well protected the sector looks against new technology or new competitors that could change the way it makes money.
- Alphabetical
- A to Z, for when you just want to find a sector by its name.
Sorting only changes the order of the list. It does not change any score.
How it connects to the company score
In the screener and on each company page, every company gets a score out of 36 across six areas. One of those six areas is Sector outlook, and it draws on this sector analysis. So the context you read here also counts in the score of each company in that sector.
Want to see how that score is built and how to use it?
What it is, and what it is not
It is
- A way to see the context a company works in
- A quick way to compare sectors side by side
- A dated starting point for your own research
It is not
- Advice: it does not tell you what to do with your money
- About you: it knows nothing about your goals, your time frame or what you already own
- Always right: an AI summary can be wrong or out of date
Curious why different sectors rise and fall at different stages of the economy?
Read our guide to sector rotationQuestions about sector analysis
You can create a free account at my.worthmap.com. The free plan is in beta, so what each plan includes may still change. The app works in English, Italian, French, German, Chinese and Spanish.
Each sector card shows the date its analysis was last updated, so you can always see how recent it is. Look at that date before you rely on a summary: markets move, and an older analysis may no longer describe the sector well.
They are written by AI from public data. Generating the analysis of a sector takes a few minutes. AI can misread a figure or miss recent news, so treat each summary as one dated opinion and compare it with other sources.
No. A score describes a whole sector at one date. It says nothing about any single company, about the price you would pay or about your own situation, goals and the risk you can live with. A sector with a high score can still fall, and a low score does not describe every company in that sector. Use the score to decide where to read more, not what to do with your money.
Compare the sectors yourself in the app: you can start with a free account.
Create free accountFor information and education only. Worthmap does not know your situation and does not give personal investment advice. Nothing on this page is a recommendation to invest in any security or sector. Investing carries risk, including the loss of money. Read the full disclaimer