
WACC Calculator
Weighted Average Cost of Capital for any company
Enter five figures and see the return this company has to earn
Free · No sign-up · Updates as you type
Who funds the company
Where to find it
Where to find it
What shareholders expect
What this number means
How CAPM works
%
Where to find it
What this number means
%
What this number means
Estimated cost of equity: 9.00%
Change any of these three numbers and the Return shareholders expect field above updates by itself.
What the loans cost
Where to find it
What picking a country does
What this number means
Return this company has to earn each year (its WACC)
7.56%
That is what its shareholders and its lenders expect between them, weighted by how much money each has put in. Use it as the discount rate in a DCF: a business or a project that earns more than 7.56% a year adds value, one that earns less loses it.
The numbers behind that
Shareholders' part
They put up 71.4% of the money and expect 9.0% a year. 71.4% of 9.0% is 6.43%.
6.43%
Lenders' part
They put up 28.6% at 5.0%. Interest is tax-deductible, so at a tax rate of 21.0% it really costs 3.95%. 28.6% of 3.95% is 1.13%.
1.13%
Together
6.43% plus 1.13%.
7.56%
Who funds the company
Shareholders 71.4%
Lenders 28.6%
What moves this figure
Click a line to jump to the field it talks about.
- The return shareholders expect is the one figure here you have to estimate. At 10.0% instead of 9.0%, the company would have to earn 8.27%.
- If its loans cost 6.0% instead of 5.0%, it would have to earn 7.78%.
- Without the tax deduction on interest it would have to earn 7.86%. The deduction takes 0.30 points off.
What if the cost of equity is not exactly right?
The cost of equity is the one figure here you have to estimate instead of look up, so it is worth seeing how much your answer leans on it. Everything else stays at your own numbers, and only the cost of equity moves.
| If the cost of equity is | your WACC becomes |
|---|---|
| 7.0% | 6.13% |
| 8.0% | 6.84% |
| 9.0%yours | 7.56% |
| 10.0% | 8.27% |
| 11.0% | 8.99% |
If the company carries debt, a one point change in the cost of equity moves the WACC by less than a full point, because equity funds only part of the business. The bigger the equity share, the closer the two move together, and a company with no debt at all moves point for point.
Insight: A company's WACC represents the minimum return it must earn on existing assets to satisfy its creditors, owners, and other capital providers. Projects with returns above the WACC create value; those below destroy it.
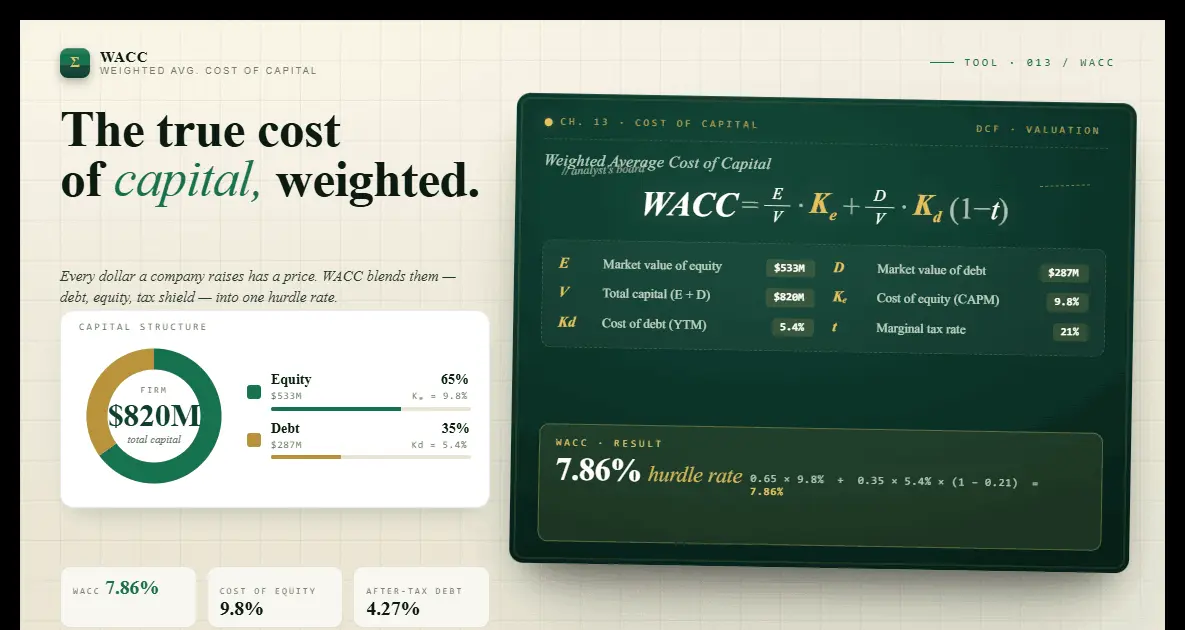
The Weighted Average Cost of Capital (WACC) is the average rate a company is expected to pay to finance its assets. It blends the cost of equity and the after-tax cost of debt, weighted by their respective proportions in the capital structure.
WACC = (E/V × Re) + (D/V × Rd × (1 − T))
Step 1: Enter the market value of equity (market cap) and market value of debt (total outstanding debt).
Step 2: Enter the cost of equity (often estimated using CAPM: Risk-Free Rate + Beta × Market Risk Premium).
Step 3: Enter the cost of debt (average interest rate on borrowings) and the corporate tax rate.
Step 4: There is no Calculate button. The WACC, the capital weights and the contribution breakdown update as you type, so change any figure and the result moves with it.
What Is WACC (Weighted Average Cost of Capital)?
The Weighted Average Cost of Capital (WACC) is one of the most important metrics in corporate finance. It represents the blended cost a company pays to finance its operations through a mix of equity and debt. WACC is the minimum rate of return a company must earn on its existing asset base to satisfy its investors, creditors, and other capital providers.
WACC is heavily used in discounted cash flow (DCF) analysis as the discount rate applied to future free cash flows. A higher WACC means future cash flows are worth less today, resulting in a lower company valuation. If you would rather build the whole idea up from scratch, with every input explained, our plain-English guide to WACC goes through the same formula step by step.
The WACC Formula Explained
WACC = (E/V × Re) + (D/V × Rd × (1 − T))
The formula weights each source of capital by its proportion in the total capital structure. The cost of debt is adjusted for the tax shield because interest payments are tax-deductible.
The cost of equity is typically estimated using the Capital Asset Pricing Model (CAPM): Re = Risk-Free Rate + Beta × Equity Risk Premium.
How Is WACC Used in Practice?
Investment analysts use WACC as the discount rate in DCF models to value companies and stocks. If a company's return on invested capital (ROIC) exceeds its WACC, it is creating economic value.
Corporate managers use WACC as a hurdle rate for capital budgeting decisions. Any new project must generate returns above the WACC to be considered value-creating. Actually discounting a set of cash flows with the rate you get here is a job of its own, and our guide to using WACC as a DCF discount rate shows how the discounting and the terminal value fit together, and why half a point of WACC moves the valuation so much.
Limitations of WACC
WACC assumes a constant capital structure. In reality, a company's mix of debt and equity changes over time.
WACC is most reliable for established companies with stable capital structures. For startups or high-growth companies, WACC may not accurately reflect the true cost of capital.
Frequently Asked Questions About the WACC Calculator
WACC stands for weighted average cost of capital. It is the blended price a company pays for the money it uses, part of it borrowed and part of it put in by shareholders, weighted by how much of each it has. It matters because the same number doubles as the discount rate in a DCF valuation and as the hurdle every new project has to clear. A company that keeps earning less than its WACC is destroying value, even while it reports a profit.
WACC = (E/V × Re) + (D/V × Rd × (1 − T)). E is the market value of equity, D is the market value of debt, V is E plus D, Re is the cost of equity, Rd is the cost of debt before tax and T is the corporate tax rate. Take the example already filled in above: $500M of equity and $200M of debt, so equity funds 71.4% of the business and debt 28.6%. Equity contributes 0.714 × 9% = 6.43%, debt contributes 0.286 × 5% × (1 − 0.21) = 1.13%, and the two add up to a WACC of 7.56%.
Most people use the capital asset pricing model: cost of equity = risk-free rate + beta × (market return − risk-free rate). The risk-free rate is normally the yield on a 10-year government bond. Beta measures how strongly the share moves with the market and is published on most stock data pages. The gap between the market return and the risk-free rate is the equity risk premium, commonly assumed to be somewhere around 4% to 6% depending on the market and the source you use. The CAPM helper on this page does that arithmetic and writes the answer straight into the Cost of Equity field.
There is no single good number, because WACC follows the risk of the business and the mix of debt and equity behind it. Most established companies land somewhere between roughly 6% and 12%. Utilities and consumer staples, stable and carrying plenty of cheap debt, sit at the low end. Young technology companies, funded mostly by equity that demands a high return, sit at the high end. The comparison that actually tells you something is not against other companies but against the same company's return on invested capital: earn more than the WACC and the business creates value, earn less and it destroys it.
Interest is an expense a company deducts before it is taxed, so borrowing costs less than the headline rate suggests. In the example above, a 5% interest rate and a 21% tax rate give an after-tax cost of debt of 5% × (1 − 0.21) = 3.95%. Dividends paid to shareholders get no such deduction, which is why debt looks cheaper than equity in the formula and why almost every large company carries some. The saving is only real while the company earns enough profit to use the deduction.
How CAPM and beta set the cost of equity in your WACC
The Capital Asset Pricing Model (CAPM) is the standard method for estimating the cost of equity in the WACC formula. The CAPM formula is: Re = Rf + β × (Rm − Rf), where Rf is the risk-free rate (typically the 10-year government bond yield), β (beta) is the stock's systematic risk relative to the market, and (Rm − Rf) is the equity risk premium. Beta below 1 means the stock moves less than the market; beta above 1 means it amplifies market moves. A beta calculator helps you estimate this input from historical price data. If those terms are new to you, the CAPM entry in our glossary gives the short definition with a worked number.
In practice, analysts use industry beta (also called unlevered or asset beta) as a starting point, then re-lever it for the company's specific debt-to-equity ratio. This prevents the cost of equity estimate from being distorted by the company's capital structure. Re-levering uses the Hamada equation: βL = βU × [1 + (1 − T) × (D/E)], where T is the tax rate and D/E is the debt-to-equity ratio. This is why the same WACC calculator is used both as a CAPM calculator (to get Re) and as a capital structure optimisation tool. For the longer version, including what beta really measures and how much it moves the final number, our article on the cost of equity takes it apart with a worked example.
How enterprise value and EBITDA multiples connect to your WACC
Enterprise value (EV) is the total value of a business, the theoretical takeover price. EV = Market Capitalisation + Total Debt − Cash and Cash Equivalents. Unlike market cap, EV accounts for a company's debt load, making it a more complete measure of what you are actually paying when you acquire a business. An enterprise value calculator is essential for comparing companies with different capital structures, a company with high debt and low market cap may be worth less than its market cap suggests.
EBITDA, Earnings Before Interest, Taxes, Depreciation and Amortisation, is the most common denominator in relative valuation. The EV/EBITDA multiple (enterprise value divided by EBITDA) is used to compare companies across industries because it is capital-structure neutral and removes the effects of differing tax rates and accounting depreciation choices. An EBITDA calculator starts with operating income (EBIT) and adds back depreciation and amortisation. WACC is the bridge between EBITDA-based multiples and DCF analysis: in a DCF model, WACC discounts free cash flows (which are derived from EBITDA less capex, taxes, and working capital changes) back to their present value.
Take Your Financial Analysis Further
WACC is a building block of professional valuation. The number it gives you is the discount rate the present value, NPV and DCF calculators ask for next, and all three are free on Worthmap.
Create free accountBuilt & maintained by Worthmap · Last updated September 29, 2026
Educational use only. This tool provides estimates for informational purposes and does not constitute financial, investment, tax, or legal advice. Results are based on inputs you provide and mathematical models, they do not guarantee future performance. Always consult a qualified financial adviser before making investment decisions.