
Option Pricing Calculator
What the model says a call or put is worth, and what drives it
Enter the option and see what the model says it is worth
Free · No sign-up · Updates as you type
An option is the right to buy (a call) or sell (a put) a share at a fixed price until a fixed date.
How an option works
An option is a contract that gives you the right (not the obligation) to buy or sell a stock at a fixed price by a fixed date. A call profits if the stock rises; a put profits if it falls. This tool estimates what that contract is worth today, using the Black-Scholes model.
What one share trades at today, in any currency, e.g. 155.
The fixed price the option locks in, e.g. 150.
Calendar days left, e.g. 30.
The IV column of the option chain: the yearly swing the market expects, e.g. 25.
Yield of a short government bond, e.g. 5. On options of a few weeks it moves the price little.
By the model, this call is worth 7.72 a share: 772.00 for 100 shares
The share is at 155.00, which is 5.00 above the 150.00 strike. That 5.00 is what the call would pay if it expired today. The other 2.72 pays for what could still happen in the 30 days left, and it shrinks to nothing by expiry.
The numbers behind that
Paid out if it expired today
The 155.00 share price less the 150.00 strike. Traders call this the intrinsic value.
5.00
Paid for the time left
7.72 less 5.00. It is the price of what could still happen in 30 days, and none of it is left at expiry. Traders call this the time value.
2.72
Share price to break even at expiry
The 150.00 strike plus the 7.72 paid. Today the share is at 155.00. A buyer who paid 7.72 makes money only if the share ends above 157.72 at expiry. If it ends between 150.00 and 157.72, the call pays back only part of the 7.72 paid. If it ends at 150.00 or below, the call pays nothing and the buyer loses the 772.00 paid for 100 shares.
157.72
The put with the same strike
Same share, strike, days and volatility, but it pays when the share falls. Press Put above to see it in full.
2.11
What changes it most
Click a line to jump to the field you would change.
This is a model's figure, not a quote: it knows only the five numbers you typed.
What the model leaves out
If you typed the implied volatility from your broker's option chain, expect a figure close to the quoted price, because that volatility is itself worked out from the price. The model also assumes the share pays no dividend before expiry and that the option can only be used on its last day. For an option you can exercise early, or a share about to pay a dividend, treat the figure as an approximation. The figure for 100 shares is only the per share figure times 100: check how many shares one contract covers at your broker.
What it would be worth if the share moved today
Same strike, same days left, same volatility. Only the share price changes.
| If the share were at | This call would be worth |
|---|---|
| 139.50 (-10%) | 0.94 |
| 147.25 (-5%) | 3.26 |
| 155.00 (now) | 7.72 |
| 162.75 (+5%) | 14.00 |
| 170.50 (+10%) | 21.26 |
The Greeks (for traders)
Each Greek measures how the price reacts to one thing changing. Full explanations are in the section below.
Delta (Δ)
0.7091
change when the share moves by 1
Gamma (Γ)
0.0309
how fast Delta changes
Vega (ν)
0.15
change for 1 point more volatility
Theta (Θ)
-0.08
change for each day that passes
Rho (ρ)
0.08
change for 1 point more interest
d1 / d2
0.551 / 0.479
model intermediates
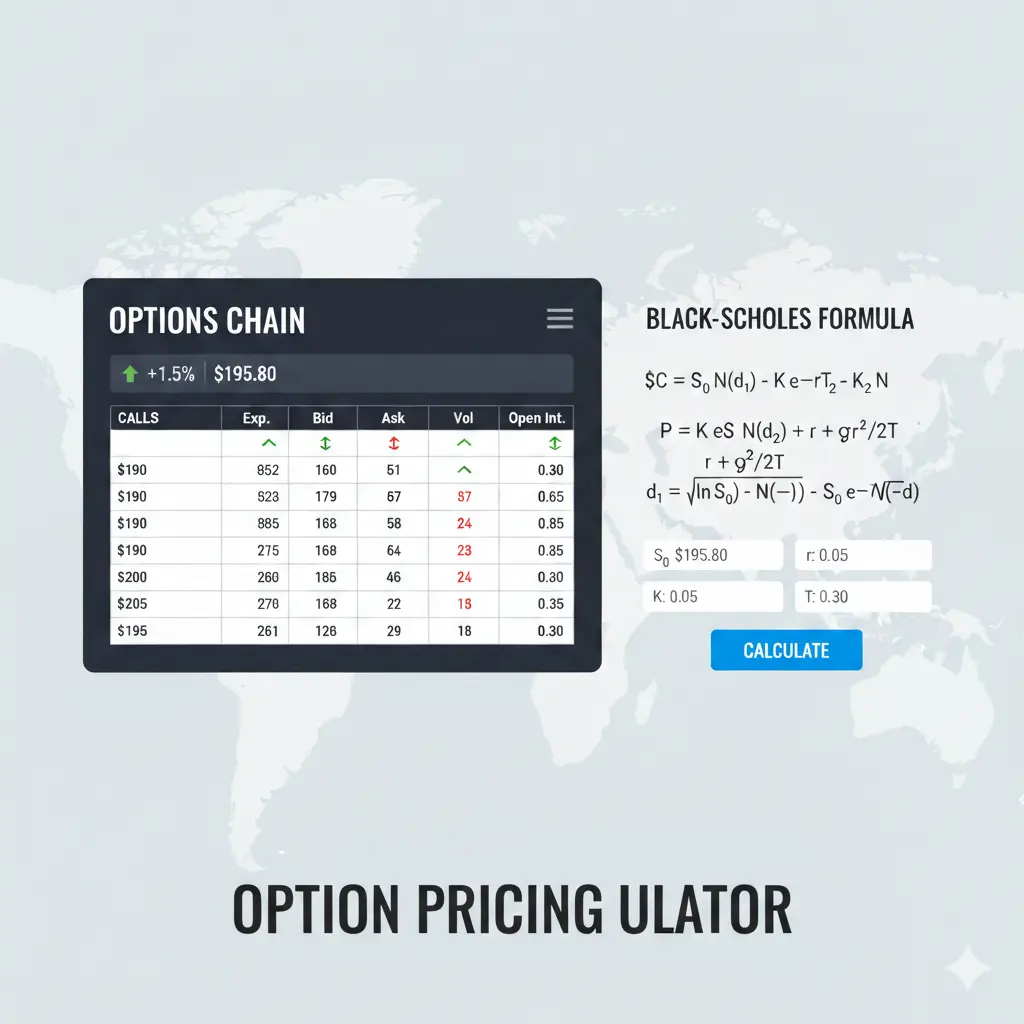
This calculator uses the Black-Scholes model, developed by Fischer Black, Myron Scholes, and Robert Merton in 1973. It gives the theoretical fair value of European-style call and put options and is the foundation of modern options pricing.
C = S·N(d₁) − K·e^(−rT)·N(d₂)
Delta (Δ): how much the option price moves when the share moves by 1. A delta of 0.60 means the option gains about 0.60 when the share rises by 1.
Gamma (Γ): how fast Delta itself changes as the share moves. High gamma means Delta swings quickly, common when the share is near the strike close to expiry.
Vega (ν): how much the price moves when implied volatility changes by 1 point, for example from 25% to 26%. Higher vega means the option reacts more to volatility shifts.
Theta (Θ): time decay, or how much value the option loses each day, all else equal. It works against buyers and for sellers as expiry approaches.
Rho (ρ): how much the price moves when the interest rate changes by 1 point, for example from 5% to 6%. Usually the smallest effect, and it matters most for long-dated options.
What Is the Black-Scholes Option Pricing Model?
The Black-Scholes model is a mathematical framework for pricing European-style options. Published in 1973 by Fischer Black and Myron Scholes, with key contributions from Robert Merton, it changed financial markets by giving the first widely adopted formula for an option's fair value from observable market inputs.
The model takes five inputs (stock price, strike price, time to expiry, risk-free rate, and implied volatility) and returns a theoretical price for both calls and puts. Despite its simplifying assumptions, it stays the industry standard and the base on which more complex models are built.
The Black-Scholes Formula
C = S·N(d₁) − K·e^(−rT)·N(d₂)
d₁ = [ln(S/K) + (r + σ²/2)T] / (σ√T)
The formula prices the option as the expected stock value (weighted by the chance of exercise) minus the present value of the strike (weighted by the chance the option finishes in the money). N(d₁) and N(d₂) are cumulative standard-normal probabilities.
The put price follows from put-call parity: P = K·e^(−rT)·N(−d₂) − S·N(−d₁). Parity keeps call and put prices consistent, so knowing one gives you the other.
Understanding Implied Volatility
Implied volatility (IV) is the market's forecast of how much the stock will move. Unlike historical volatility, which looks back, IV is forward-looking and baked into the option's market price. Higher IV means the market expects bigger swings, which lifts the premium on both calls and puts.
Traders compare IV to historical volatility to judge whether options look cheap or expensive. When IV sits well above historical volatility, premiums may be rich; when below, they may be a bargain. Run in reverse, this tool doubles as an implied-volatility finder: nudge the volatility input until the model price matches the option's market price, and you have the IV the market is pricing in.
Limitations of the Black-Scholes Model
The model assumes constant volatility and interest rates, a log-normal price distribution, no dividends, no transaction costs, and European exercise only. In reality volatility changes over time and differs from one strike to the next (the pattern traders call the "volatility smile"), stocks pay dividends, and many listed options are American-style.
Even so, Black-Scholes is the most common starting point. Practitioners adjust for dividends, switch to a binomial model for American options, and apply volatility surfaces for the smile. Its simplicity and clean formula make it indispensable for fast pricing and risk checks.
How the Greeks Drive Common Options Strategies
This tool prices a single option, but most traders combine several into a strategy. In a covered call you own 100 shares and sell a call against them, collecting premium in exchange for capping your upside. The model price here shows how much of that premium is time value, the part a seller keeps if the share price has not moved by expiry.
In a cash-secured put you sell a put while holding enough cash to buy the shares if assigned, earning premium and a chance to buy lower. Implied volatility and Theta tell you whether the premium pays you enough for the risk. Theta, the daily loss of value as expiry nears, works in your favour when you are the seller.
Across every strategy the Greeks are the controls. Delta is your directional exposure, Gamma how fast that exposure shifts, Theta the time decay you earn or pay, Vega your sensitivity to volatility, and Rho your exposure to interest rates. Reading them together is how traders shape and hedge a position.
Frequently Asked Questions
Implied volatility sits in the option chain on your broker or on financial data sites, usually in a column marked "IV". The CBOE VIX index tracks the implied volatility of S&P 500 options and is the popular market-wide gauge. For a single stock, read the IV straight from its option chain.
Black-Scholes prices European options, which you can only exercise at expiry. For American calls on a stock that pays no dividend, the price matches the European call, because exercising early is never worth it. For American puts, or calls on dividend payers, treat this as an approximation; a binomial tree is more accurate.
Delta has three everyday readings: the expected change in the option price for a $1 move in the stock; a rough probability the option finishes in the money; and the equivalent share position (a delta of 0.50 on one contract behaves like 50 shares). It is the Greek traders lean on most for sizing and hedging.
The extra is time value: what buyers pay for the chance the option moves further into profit before expiry. It grows with more time left and higher volatility, and it melts away as expiry nears (that erosion is Theta). At expiry, time value is zero and the option is worth only its intrinsic value.
Manage Your Whole Portfolio in One Place
Options pricing is one piece of the puzzle. With a free Worthmap account, you can record what you own and owe in each currency, see your net worth in one base currency over time, and use the stock screener and AI analysis. The free plan is in beta.
Create free accountBuilt & maintained by Worthmap · Last updated October 6, 2026
Educational use only. This tool provides estimates for informational purposes and does not constitute financial, investment, tax, or legal advice. Results are based on inputs you provide and mathematical models, they do not guarantee future performance. Always consult a qualified financial adviser before making investment decisions.