Calculateur d'intérêts composés
Découvrez comment vos investissements croissent dans le temps grâce à la puissance des intérêts composés
Votre plan d'investissement
Gratuit · Sans inscription · Se met à jour à la saisie$
Votre montant de départ. Peut être 0.
$
Ajouté chaque mois. Peut être 0.
Rendement de long terme, p. ex. 8 pour 8 %. Le S&P 500 a rapporté environ 10 % en moyenne.
ans
Combien de temps vous restez investi, p. ex. 20.
Valeur future
343 778 $
après 20 ans
En clair : vous partez de 10 000 $ et ajoutez 500 $ par mois pendant 20 ans, en versant 130 000 $ de votre poche. À 8 % par an, avec une capitalisation chaque mois, cela devient 343 778 $, dont 213 778 $ de croissance composée au-delà de ce que vous avez versé. À 8 %, votre argent double environ tous les 9.0 ans (règle de 72).
Total des versements
130 000 $
Total des intérêts gagnés
213 778 $
Taux annuel effectif
8,30 %
Intérêts en % du total
62,2 %
Comparez différents taux de rendement
Ajoutez d'autres taux de rendement annuels pour voir comment même de petites différences de performance changent radicalement votre patrimoine à long terme.
%
| Taux de rendement | Valeur finale | Intérêts | Différence |
|---|---|---|---|
| 10% | 452 965 $ | 322 965 $ | +109 187 $ |
| 8% (votre taux) | 343 778 $ | 213 778 $ | — |
| 5% | 232 643 $ | 102 643 $ | -111 135 $ |
De petites différences se composent en sommes qui changent une vie. Comme vous pouvez le voir ci-dessus, même une différence de 1 à 2 % dans les rendements annuels peut représenter des dizaines ou des centaines de milliers de dollars sur un long horizon d'investissement. La question est : comment augmentez-vous vos rendements ? Le scanner d'actions propulsé par l'IA de Worthmap, l'analyse du nombre de Graham et les outils de filtrage fondamental vous aident à repérer les opportunités sous-évaluées que le marché valorise mal, vous donnant l'avantage de la recherche pour prendre de meilleures décisions d'investissement et potentiellement améliorer vos rendements à long terme.
Explorez les outils d'investissement gratuits de Worthmap →Détail de la croissance
| Année | Versements | Intérêts | Valeur totale |
|---|---|---|---|
| 1 | 16 000 $ | 1 055 $ | 17 055 $ |
| 2 | 22 000 $ | 2 695 $ | 24 695 $ |
| 3 | 28 000 $ | 4 970 $ | 32 970 $ |
| 4 | 34 000 $ | 7 932 $ | 41 932 $ |
| 5 | 40 000 $ | 11 637 $ | 51 637 $ |
| ··· | |||
| 16 | 106 000 $ | 123 419 $ | 229 419 $ |
| 17 | 112 000 $ | 142 685 $ | 254 685 $ |
| 18 | 118 000 $ | 164 049 $ | 282 049 $ |
| 19 | 124 000 $ | 187 684 $ | 311 684 $ |
| 20 | 130 000 $ | 213 778 $ | 343 778 $ |
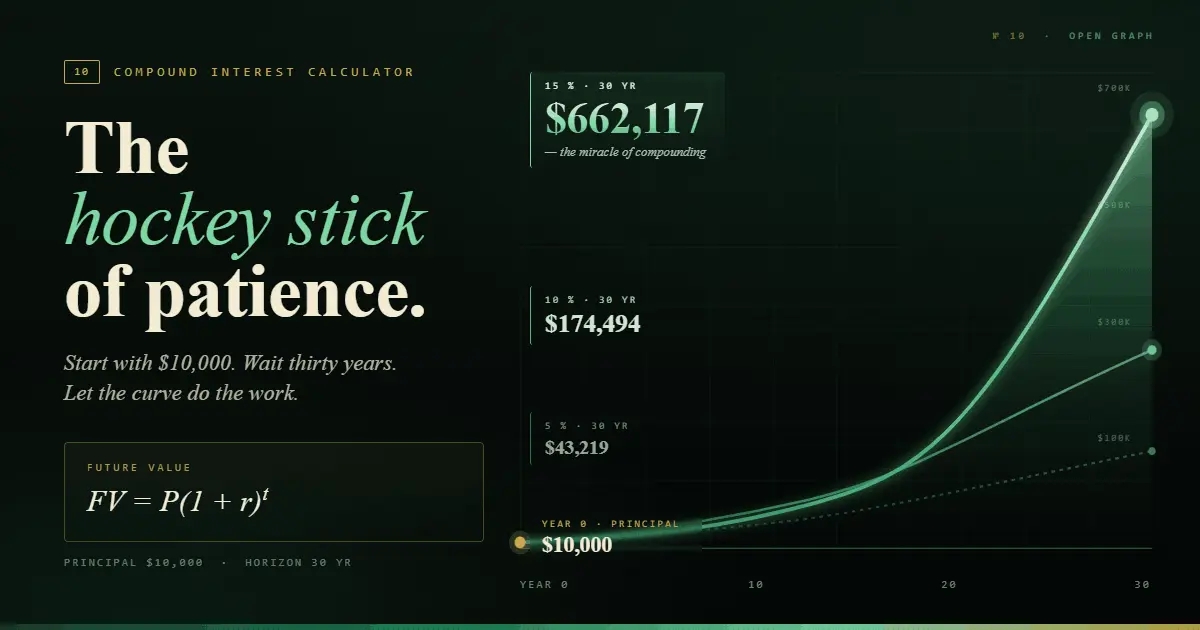
À retenir : Les intérêts composés sont la force la plus puissante de l'investissement. Plus votre horizon de temps est long, plus l'effet de capitalisation devient spectaculaire. Remarquez comme les intérêts gagnés s'accélèrent au fil des dernières années : c'est pourquoi commencer tôt compte bien plus que le montant que vous investissez.
Les intérêts composés sont le processus par lequel on gagne des intérêts à la fois sur le capital initial et sur les intérêts déjà accumulés. Contrairement aux intérêts simples (calculés uniquement sur le montant initial), les intérêts composés font croître votre patrimoine de façon exponentielle dans le temps. Albert Einstein les aurait qualifiés de huitième merveille du monde.
FV = P(1 + r/n)^(nt) + PMT × [((1 + r/n)^(nt) - 1) / (r/n)]
Étape 1: Saisissez le montant de votre investissement initial (le capital de départ). Il peut être nul si vous partez de zéro.
Étape 2: Saisissez votre versement mensuel, le montant que vous prévoyez d'ajouter chaque mois via un investissement programmé (dollar cost averaging) ou un plan d'investissement systématique.
Étape 3: Définissez votre taux de rendement annuel attendu. La moyenne historique du S&P 500 est d'environ 10 %, même si de nombreux planificateurs utilisent 7 à 8 % pour tenir compte de l'inflation.
Étape 4: Choisissez votre durée d'investissement et la fréquence de capitalisation. La projection et le détail année par année se mettent à jour instantanément à la saisie.
Qu'est-ce que les intérêts composés ?
Les intérêts composés sont le mécanisme par lequel les gains de votre investissement génèrent à leur tour leurs propres gains. Lorsque vous investissez 10 000 $ à un rendement annuel de 8 %, vous gagnez 800 $ la première année. La deuxième année, vous gagnez 8 % sur 10 800 $, soit 864 $. À la 20e année, vos seuls gains annuels dépassent votre investissement initial. Cette croissance exponentielle est le fondement de la constitution d'un patrimoine sur le long terme.
Les variables clés qui déterminent la croissance composée sont le capital, le taux de rendement, la fréquence de capitalisation et, surtout, le temps. Plus votre argent se capitalise longtemps, plus les résultats sont spectaculaires. C'est pourquoi un calculateur d'investissement pour la croissance composée est l'un des outils les plus importants pour quiconque prépare son avenir financier, que vous épargniez pour la retraite, pour un achat important ou pour atteindre votre chiffre d'indépendance financière.
Investissement programmé et intérêts composés
L'investissement programmé (dollar cost averaging, DCA), c'est-à-dire investir un montant fixe à intervalles réguliers, est l'une des stratégies les plus efficaces pour constituer un patrimoine dans le temps. Ce calculateur de dollar cost averaging montre comment même de modestes versements mensuels peuvent croître en sommes substantielles lorsqu'ils sont combinés aux intérêts composés. Un plan d'investissement systématique de 500 $ par mois à 8 % de rendement annuel croît à environ 475 000 $ en 25 ans, alors que vous n'avez versé que 150 000 $. Utilisez-le comme calculateur de plan d'investissement systématique pour modéliser votre propre stratégie de DCA.
L'avantage de l'investissement programmé est qu'il supprime le besoin d'anticiper les mouvements du marché. En investissant régulièrement, vous achetez plus de parts quand les prix sont bas et moins quand ils sont élevés, ce qui lisse naturellement votre prix de revient. Combinée aux intérêts composés, cette approche disciplinée a historiquement surperformé la plupart des stratégies de trading actif sur de longs horizons de temps.
Les intérêts composés pour préparer la retraite
Un calculateur d'investissement pour préparer la retraite vous aide à répondre à la question financière la plus importante : en aurai-je assez ? En projetant votre épargne actuelle et vos versements à un taux de rendement réaliste, vous pouvez voir si vous êtes sur la bonne voie pour atteindre votre chiffre d'indépendance financière, et comment l'ajustement de vos versements ou de votre échéance modifie le résultat. Voyez-le comme votre calculateur d'investissement pour la retraite : saisissez votre chiffre cible et remontez le raisonnement pour trouver le versement mensuel et le taux de rendement dont vous avez besoin.
Pour celles et ceux qui visent l'indépendance financière, ce calculateur est essentiel pour la planification Coast FIRE (où vos investissements croissent jusqu'à votre objectif sans versements supplémentaires) et Barista FIRE (où un revenu à temps partiel couvre les dépenses pendant que les investissements se capitalisent). La différence entre partir à la retraite à 55 ans plutôt qu'à 65 ans tient souvent à quelques années de capitalisation supplémentaires.
Questions fréquentes sur le calculateur d'intérêts composés
Le taux approprié dépend de votre allocation d'actifs. Le S&P 500 a historiquement rapporté environ 10 % par an avant inflation (environ 7 % après inflation). Un portefeuille diversifié d'actions et d'obligations rapporte généralement 6 à 8 %. Pour des estimations prudentes, utilisez 6 à 7 %. Pour des projections optimistes, 9 à 10 %. Testez toujours plusieurs scénarios pour comprendre l'éventail des résultats possibles.
Une capitalisation plus fréquente signifie que vos intérêts commencent plus tôt à produire des intérêts, ce qui augmente légèrement votre rendement total. Par exemple, 10 000 $ à 8 % sur 20 ans croissent à 46 610 $ avec une capitalisation annuelle, mais à 49 522 $ avec une capitalisation quotidienne, soit une différence d'environ 2 912 $ (6,2 % de plus). L'effet est plus marqué avec des taux élevés et de longs horizons de temps.
La règle de 72 est une astuce de calcul mental rapide pour estimer le temps nécessaire pour doubler votre argent. Divisez 72 par votre taux de rendement annuel pour obtenir le temps de doublement approximatif. À 8 %, votre argent double en environ 9 ans (72 ÷ 8 = 9). À 10 %, il double en environ 7,2 ans. À 6 %, environ 12 ans. Cette règle vous aide à jauger rapidement la puissance de la capitalisation à différents taux.
Oui, surtout pour la planification à long terme. Vous pouvez soit utiliser un taux de rendement "réel" (taux nominal moins inflation, généralement 2 à 3 %), soit calculer en termes nominaux et ajuster séparément le chiffre final pour l'inflation. Par exemple, si vous attendez 8 % de rendements nominaux et 3 % d'inflation, utilisez 5 % comme taux de rendement réel pour voir votre valeur future en pouvoir d'achat d'aujourd'hui.
Fat FIRE, Lean FIRE et Barista FIRE : quel chiffre FIRE vous convient ?
Le FIRE, Financial Independence, Retire Early (indépendance financière, retraite anticipée), se décline en plusieurs variantes, chacune exigeant un chiffre cible différent. Le Fat FIRE vise un train de vie élevé à la retraite, nécessitant généralement 2 à 5 M$ ou plus. Un calculateur Fat FIRE applique un faible taux de retrait (2 à 3 %) à un large budget de dépenses annuelles : par exemple, dépenser 120 000 $ par an à un taux de retrait de 3 % nécessite 4 000 000 $. Ce calculateur d'intérêts composés modélise exactement ce parcours d'accumulation : saisissez votre objectif comme valeur future et remontez le raisonnement jusqu'au versement mensuel et à l'échéance nécessaires.
Le Lean FIRE vise un mode de vie frugal, généralement de 800 K$ à 1,5 M$. Un calculateur Lean FIRE applique la règle classique des 4 % à un montant de dépenses annuelles très bas : 30 000 $ par an ne nécessitent que 750 000 $. Le compromis est une marge de dépenses plus serrée et une plus grande sensibilité au risque de séquence des rendements dans les premières années de retraite. Le Barista FIRE se situe entre les deux : vous atteignez une indépendance financière partielle où les investissements couvrent la plupart des dépenses, et un revenu à temps partiel (le "job de barista") couvre le reste. Cette approche permet une date de retraite plus précoce avec un objectif d'investissement plus bas. Utilisez le calculateur Barista FIRE pour trouver votre chiffre exact de semi-retraite et voir dans combien d'années il se situe.
Le Coast FIRE est un jalon plutôt qu'un objectif de retraite complet : vous avez accumulé assez pour que, même sans versements supplémentaires, votre portefeuille se capitalise jusqu'à votre chiffre FIRE complet à l'âge de la retraite traditionnelle. Utilisez ce calculateur d'investissement pour trouver votre chiffre Coast FIRE : saisissez 0 $ comme versement mensuel, fixez la date finale à votre âge de retraite cible, et ajustez le solde de départ jusqu'à ce que la valeur finale atteigne votre objectif FIRE. Ce solde de départ est votre chiffre Coast FIRE, le point à partir duquel vous pouvez "vous laisser porter" et laisser la capitalisation faire le travail.
Calculateur de plan d'investissement systématique, rendements d'un versement unique et versements mensuels
Un calculateur de plan d'investissement systématique (SIP), parfois appelé planificateur d'investissement systématique, montre comment des versements réguliers croissent dans le temps grâce à la capitalisation. Contrairement à un calculateur d'investissement en versement unique, où vous saisissez un seul montant de départ, l'approche SIP modélise des versements mensuels ou annuels continus. Les rendements s'améliorent nettement avec des ajouts réguliers, car chaque nouveau versement commence à se capitaliser immédiatement, couche après couche, créant une courbe de patrimoine en accélération qu'un dépôt unique ne peut égaler. Utilisez le calculateur SIP dédié si vous n'avez que des versements mensuels et souhaitez une projection SIP ciblée avec prise en charge multidevise.
Les versements mensuels sont le scénario SIP le plus concret : si j'investis 500 $ par mois pendant 20 ans à un rendement annuel de 8 %, combien vaudra mon portefeuille ? Le calculateur ci-dessus traite cela directement : réglez la fréquence des versements sur mensuelle pour une projection de plan d'investissement systématique continu, ou passez à annuelle pour modéliser des versements issus d'une prime annuelle, des plafonds d'enveloppe fiscale de l'année ou des apports ponctuels. Les saisies investissement mensuel et investissement annuel fonctionnent de la même manière : chaque versement est ajouté en fin de période et commence aussitôt à se capitaliser.
Le mode calculateur d'investissement en versement unique est surtout utile lorsque vous décidez quoi faire d'une rentrée d'argent, un héritage, la vente d'une entreprise ou une prime. Ici, vous comparez le rendement de l'investissement d'une somme unique déployée immédiatement à celui d'un étalement de ce capital dans le temps via l'investissement programmé. Les recherches montrent invariablement que l'investissement en versement unique surperforme le DCA dans environ deux tiers des périodes historiques, car plus de temps sur le marché signifie plus de capitalisation. Le tiers des périodes où le DCA l'emporte tend à être celui qui précède immédiatement une correction de marché importante, ce qui fait de votre tolérance personnelle au risque et de votre horizon de temps le facteur décisif.
Suivez la croissance réelle de vos investissements
Les projections ne sont qu'une première étape. Avec Worthmap, vous pouvez suivre la croissance réelle de votre portefeuille en temps réel sur toutes les devises et tous les types d'actifs, et obtenir des analyses basées sur l'IA pour optimiser votre stratégie d'investissement.
Inscrivez-vous à Worthmap