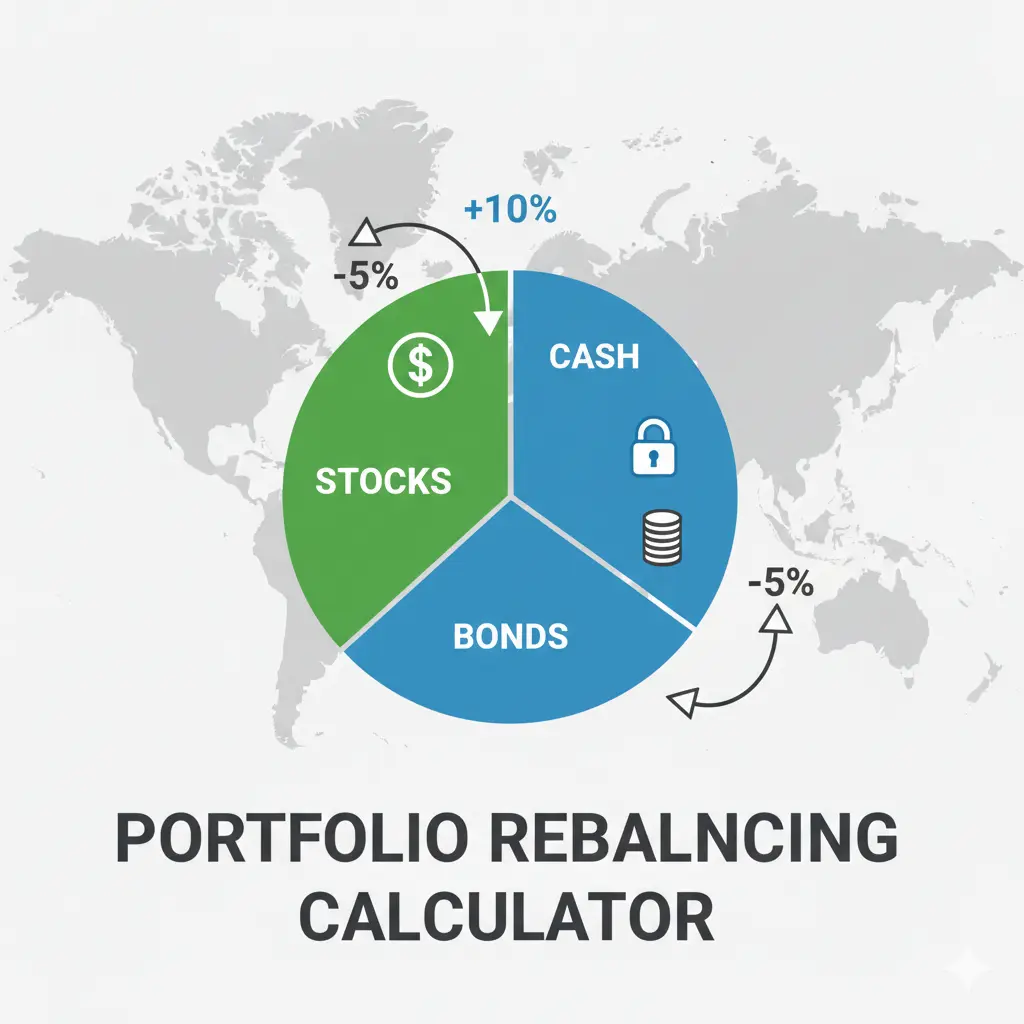
投资组合再平衡计算器
将您的投资组合与目标配置对齐
投资组合货币
当前投资组合与目标配置
输入每个资产名称、当前价值和您期望的目标配置百分比。
目标合计:
再平衡摘要
投资组合总价值
A$100,000.00
所需操作
最大调整
Australian Stocks
-A$5,000.00
当前配置 vs 目标配置
再平衡详情
| 资产 | 当前价值 | 当前 % | 目标 % | 目标价值 | 操作 | 金额 |
|---|---|---|---|---|---|---|
Australian Stocks | A$45,000.00 | 45.0% | 40.0% | A$40,000.00 | 卖出 | A$5,000.00 |
US Stocks | A$25,000.00 | 25.0% | 30.0% | A$30,000.00 | 买入 | A$5,000.00 |
International Bonds | A$20,000.00 | 20.0% | 20.0% | A$20,000.00 | 保持不变 | — |
Cash | A$10,000.00 | 10.0% | 10.0% | A$10,000.00 | 保持不变 | — |
步骤1: 选择您的投资组合货币并添加您持有的每个资产或资产类别。
步骤2: 输入每个持仓的当前市场价值和您期望的目标配置百分比。
步骤3: 确保您的目标百分比合计恰好为100%。
步骤4: 查看结果表,准确了解每个资产需要买入或卖出多少。
什么是投资组合再平衡?
投资组合再平衡是调整投资组合内资产权重的过程,使其重新与目标配置保持一致。
再平衡的目的不是最大化回报,而是维持您最初选择的风险水平。
为什么再平衡很重要
首先,它控制风险。没有再平衡,投资组合自然会向表现最好的资产类别倾斜。
其次,再平衡将纪律融入投资过程。通过系统性地减持赢家和增持落后者,您实际上在以结构化、无情绪的方式低买高卖。
第三,再平衡使您的投资组合与财务目标保持一致。
如何使用此再平衡计算器
首先输入投资组合中每个资产类别或持仓及其当前价值。然后为每个设置目标配置百分比。
计算器会把你当前的配置和目标配置作对比,明确告诉你每一类资产要买入或卖出多少,才能恢复到你想要的比例。每一项持仓都带有自己的货币,工具会用你可以编辑的汇率把所有金额换算成基准货币。当你持有不止一种货币时,还会出现一个货币再平衡面板,显示你对每种货币的敞口,以及需要调动多少才能达到目标配置。
何时应该再平衡?
基于日历的再平衡意味着按固定时间表审查您的投资组合——每季度、每半年或每年。
基于阈值的再平衡意味着只有当一个或多个资产类别偏离目标达到设定量(通常为5个百分点)时才进行再平衡。
Vanguard和其他机构的研究表明,具体的再平衡频率不如坚持执行重要。关键是制定计划并无论市场条件如何都坚持执行。
不卖出的再平衡:现金流方法
最节税的再平衡方式之一是将新的贡献导向配置不足的资产类别,而不是卖出配置过多的资产。
需要避免的常见再平衡错误
最常见的错误是根本不做再平衡。许多投资者设定目标配置后就不再审查,让投资组合随市场波动漂移数年。
过度再平衡是另一个陷阱。过于频繁地再平衡会产生不必要的交易成本和潜在的税务后果。
基于情绪而非目标的再平衡也是有问题的。坚持您预定的目标,让流程发挥作用。
常见问题
大多数投资者使用3到10个资产类别。计算器支持最多10个资产类别。
每一项持仓都有自己的货币。计算器会用你可以编辑的汇率把所有金额换算成基准货币,这样买入和卖出的数字才有可比性。货币再平衡面板还会按货币把持仓归类,显示你的投资组合中有多少落在每种货币上,并告诉你需要调动多少才能达到目标货币配置。如果想只用一种货币操作,就让所有持仓都保持基准货币;当某项持仓在境外持有时,再改动那一行的货币即可。
再平衡主要是风险管理工具,而非回报增强策略。但由于它迫使您系统性地低买高卖,可以在长期内适度改善风险调整后的回报。
理想情况下,您应该将所有账户(经纪、退休、储蓄)的整个投资组合视为一个综合配置。
没有通用答案——取决于您的年龄、目标、风险承受能力和时间范围。
资产配置、夏普比率与回撤:衡量投资组合质量
资产配置是长期投资组合表现最重要的决定因素,影响超过个股挑选或择时。在这个资产配置计算器里,你的目标配置应当反映你的投资期限、风险承受能力和收入需求。大量学术研究(包括 Brinson、Hood 与 Beebower 1986 年那项标志性研究)将投资组合回报波动的九成以上归因于资产配置决策。把配置定对,并通过再平衡长期维持下去,是长期投资者能做出的杠杆最高的一个决定。
夏普比率衡量的是风险调整后的回报:(组合回报 减 无风险利率)÷ 标准差。夏普比率高于 1.0 通常被视为不错,高于 2.0 则属于优秀。索提诺比率在此基础上做了改进,分母只用下行波动。它惩罚向下的波动,却不惩罚向上的波动,因此对只在意亏损的投资者更有参考价值。当两个投资组合回报相近时,夏普或索提诺比率更高的那个,是用更小的风险换来了这些回报。
回撤计算器衡量的是投资组合价值从高点到低点的下跌幅度。最大回撤就是从历史高点观察到的最大一次亏损。回撤之所以是关键的风险指标,是因为投资者常常在大幅回撤中放弃自己的策略,在底部卖出,把亏损坐实。一个配置合理、再平衡得当的投资组合,其最大回撤通常小于那种在牛市之后偏向股票、配置已经漂移的组合。
费用率是持有一只基金的年度成本,用占资产的百分比表示。在一个 $500,000 的投资组合上,1% 的费用率意味着每年花掉 $5,000,这笔钱会随时间复利地侵蚀你的收益。对长期投资者来说,相比主动管理基金(费用率往往在 0.75% 到 1.5%),优先选择低成本的指数基金(费用率低于 0.20%),最终能为你的组合多积累几十万美元。在这个再平衡工具里设定目标配置时,请把每只基金的费用率考虑进去:对被动投资者而言,每一类资产里最便宜的那个选项,通常就是正确的选择。
了解再平衡背后的策略: 资本配置指南 →